A comprehensive guide about hotspots in your codebase, cognitive complexity and avoiding disasters by being proactive. An article inspired by the book “Your Code as a Crime Scene” by Adam Tornhill with practical examples.
Table of contents
Open Table of contents
Introduction
Recently, I’ve come across a book entitled "Your Code as a Crime Scene", written by Adam Tornhill. You can find the book here.
It is a book that I highly recommend to anyone who is interested in software development, especially if you are a software engineer, team lead, or architect.
So, what is actually a hotspot?
To gain a deeper understanding of this concept, let’s take a moment to explore the realm of the criminal world.
Locations where crimes occur are rarely just a simple point on a map. They usually follow a pattern and are often near the actual location of the offender.
Maybe you’ve seen this in movies, where detectives use a map with pins and strings to connect them or draw big circles to see where the crimes overlap. In the software world, just like in the criminal one, we can also pinpoint hotspots.
These are the places in our codebase that can cost us a lot of time and money if they are not addressed properly.
OK, but how to find hotspots in your project?
The first step is to identify the needs of your project. The techniques can vary depending on the size of the codebase, the number of developers, the complexity of the project, and so on.
CodeCity
CodeCity is a simple and intuitive tool for software analysis.
It provides a visual representation of your codebase, where each package is represented as a city block and each class is depicted as a building. The height of the building corresponds to the number of methods, while the base represents the number of attributes.
If you want to know more about CodeCity, or even try it out, you can find it here.
Below is an example of a CodeCity visualization:
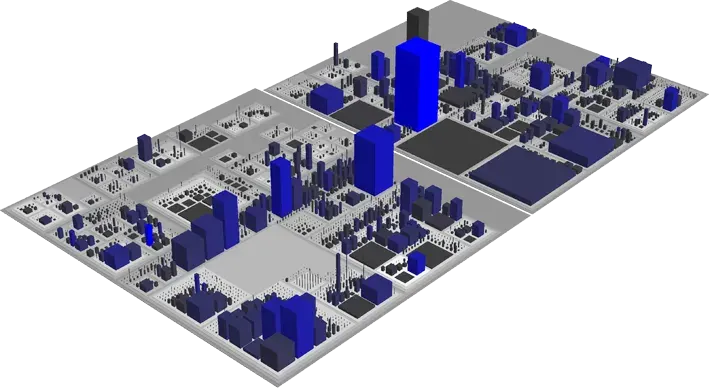
In this visualization, we can easily identify the hotspots. The tallest building, which is also the most intense in color, represents the biggest hotspot in this case, which would be a good starting point for further analysis.
Note: While CodeCity is a fun tool, you should use it with other tools and techniques to get a complete picture of your threats and potential bottlenecks.
CodeScene
Researchers proved that the frequent changes to the same code generally indicate declining quality of the code.
So, in order to have a clear picture of our possible bottlenecks, we need to combine the complexity of the code with the frequency of changes.
Here is where CodeScene comes into play.
It connects to your GIT provider and analyzes the commits and pull requests to provide a clear visualization of your codebase.
It also provides a hotspot analysis, which is a great starting point for identifying the areas that need attention.
I took the liberty to fork the doctrine/orm repository and analyze it with CodeScene:
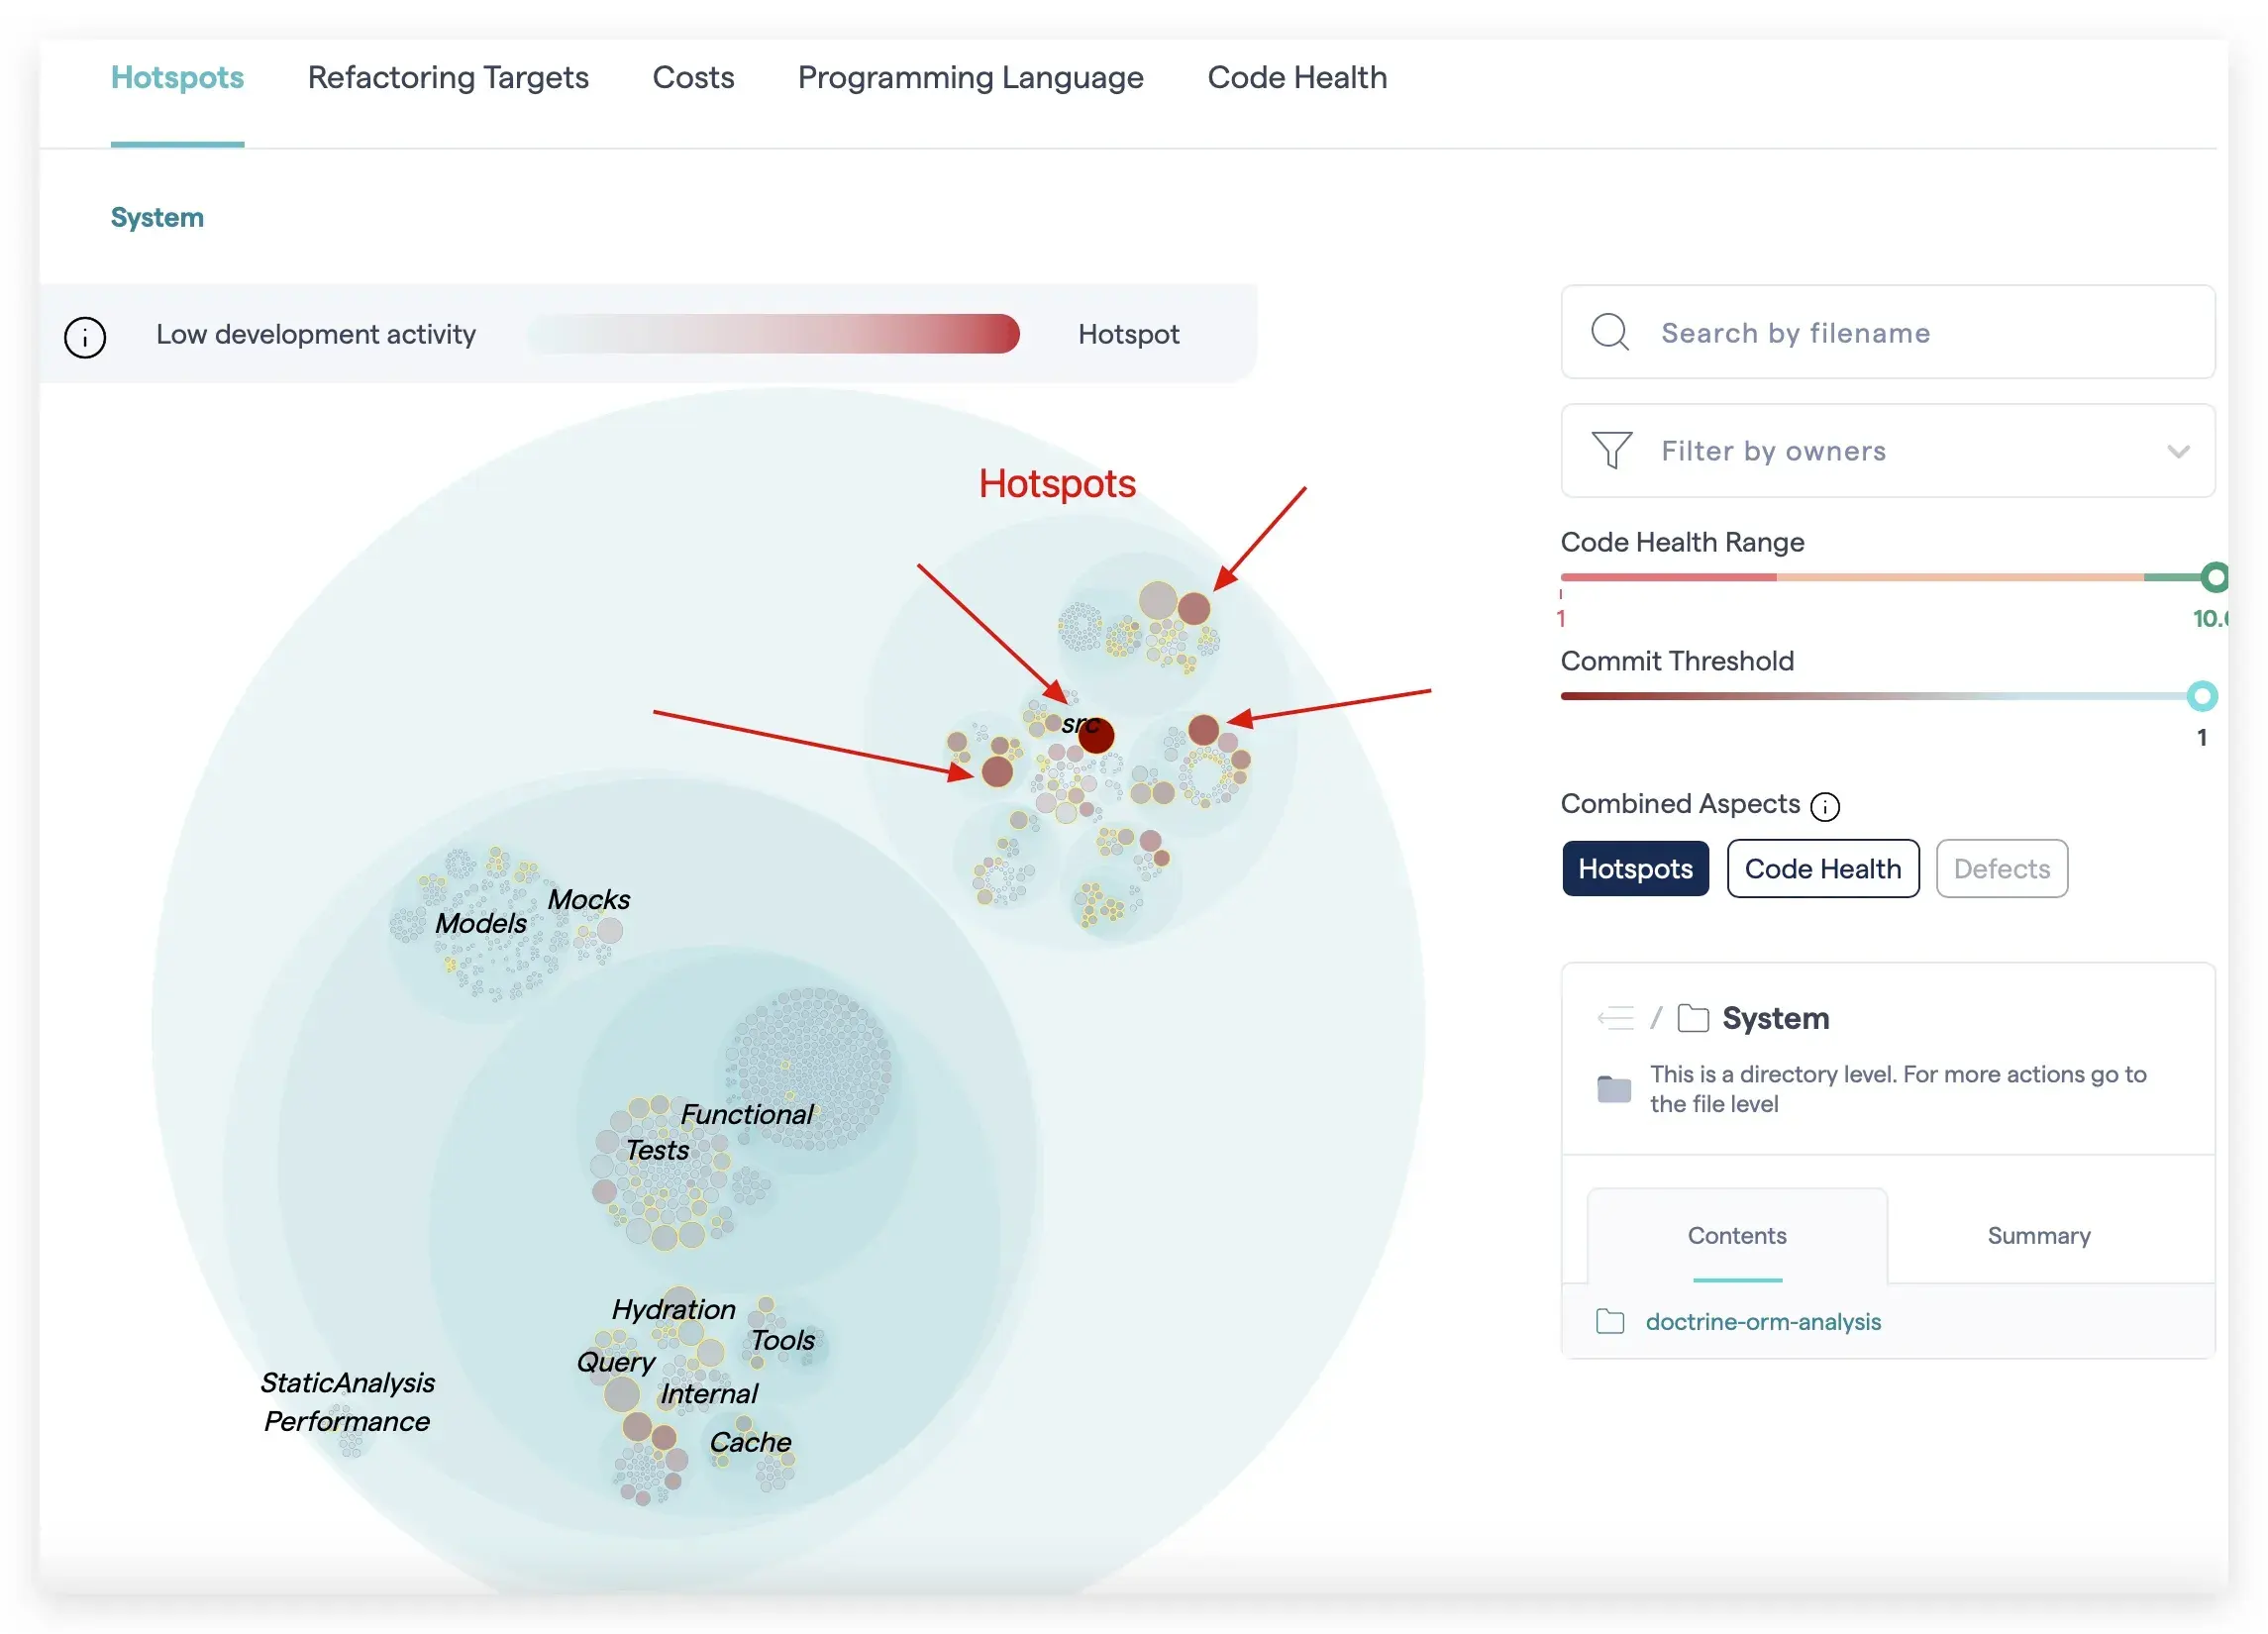
We can already see that doctrine/orm has a lot of hotspots, especially in the src directory.
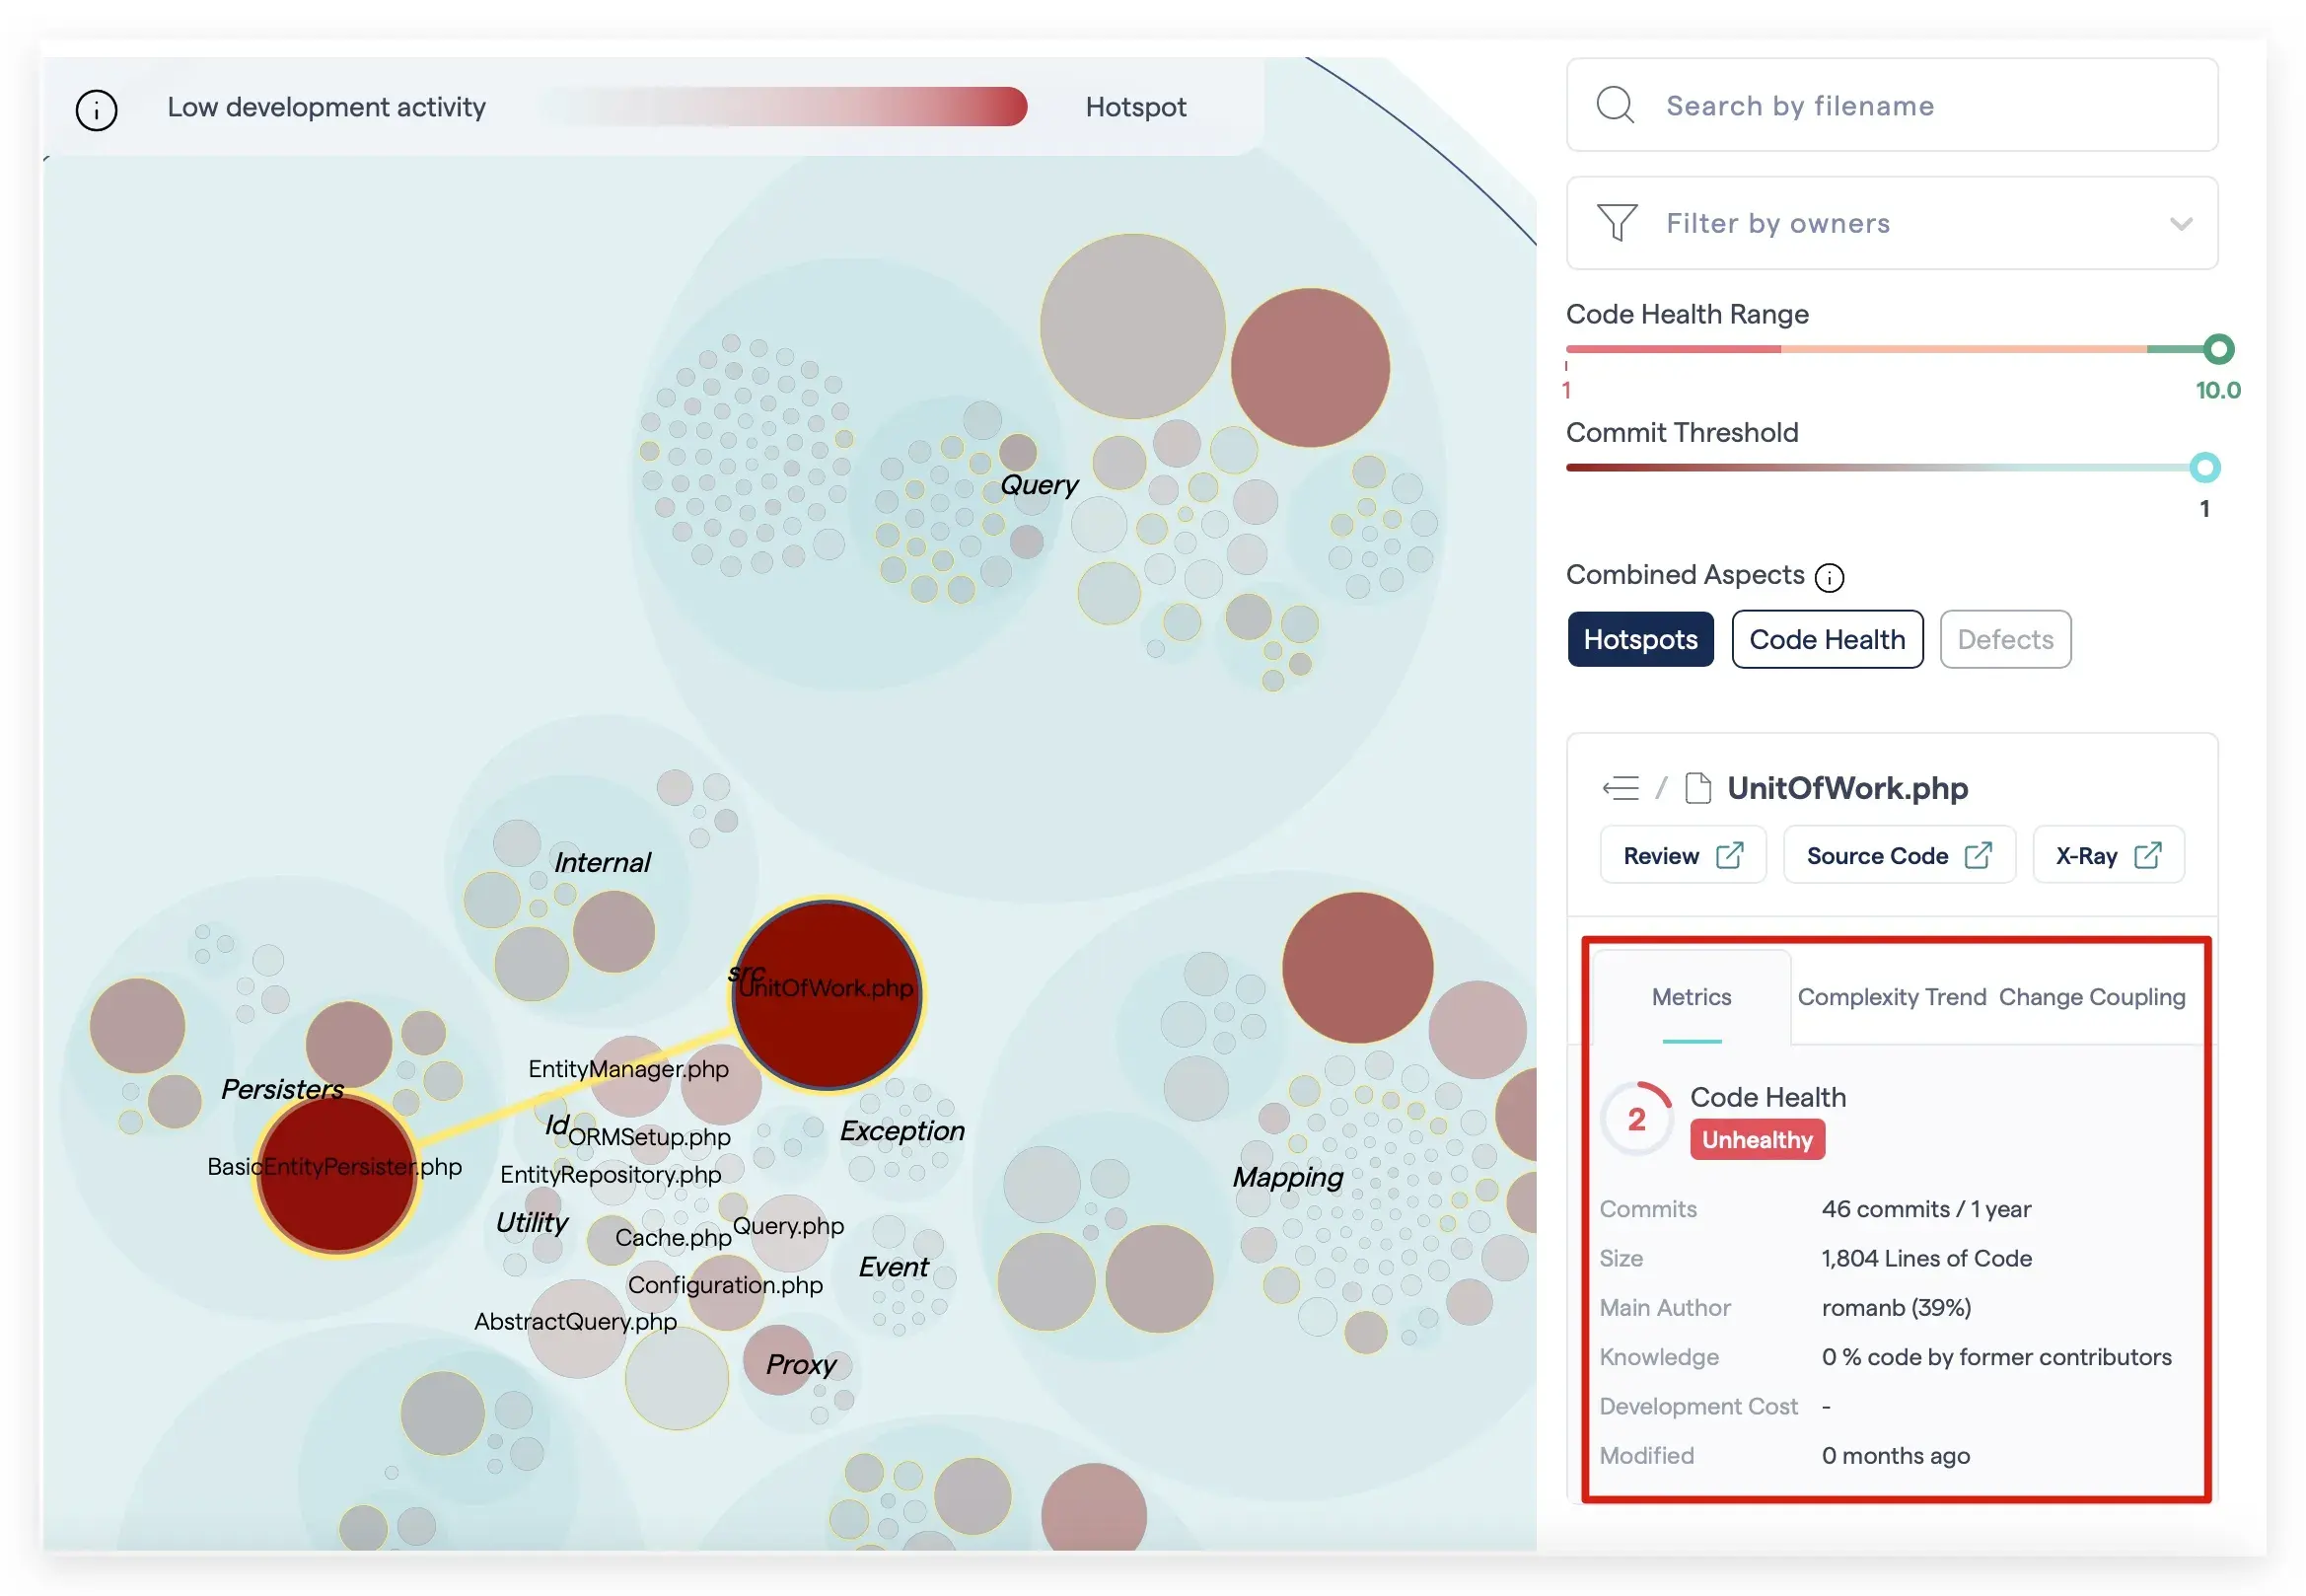
One of the most interesting ones is the UnitOfWork.php file, which has been the subject of many changes and refactorings in the past. Its complexity grew exponentially over time, along with tight coupling with other classes.
Tip: CodeScene is actually developed by Adam Tornhill! You can have fun with it here.
Preventing measures
While most of the disasters cannot be predicted in real life, we have the privilege to prevent some of them in the software world.
I will present some of the most important measures that any developer or team lead should take which require minimal to none starting costs but can have huge impacts in the long run.
1. Quality of Code Reviews
Code Review should take an important part in the development process. A good and thorough code review can prevent a lot of hotspots from appearing in the first place.
What makes a code review effective:
-
A clear picture: The reviewer should have a clear picture of the feature or bug that is being addressed. It should understand both, the
businessand thetechnical requirements. -
Live code reviews: Always aim to have
live code reviews. It doesn’t matter if you work in the same office or remotely. If you do code review while talking to the author, you will have a better understanding of the changes and the author’s intentions.
2. Pair Programming
Pair programming is a technique where two developers work on the same code at the same time. It is a great way to prevent hotspots since the code is being reviewed by someone else in real-time.
3. Static Analysis
There are a lot of tools that can help you with static analysis when you write your code. For instance, in JetBrains IDEs, you can use the SonarLint extension to analyze your code on the fly.
Tip: I use the
SonarLintextension along with theInlineErrorone. It is a great combination that helps visualize the issues in the code.
Here is a dummy example I wrote just to show you how it looks like:
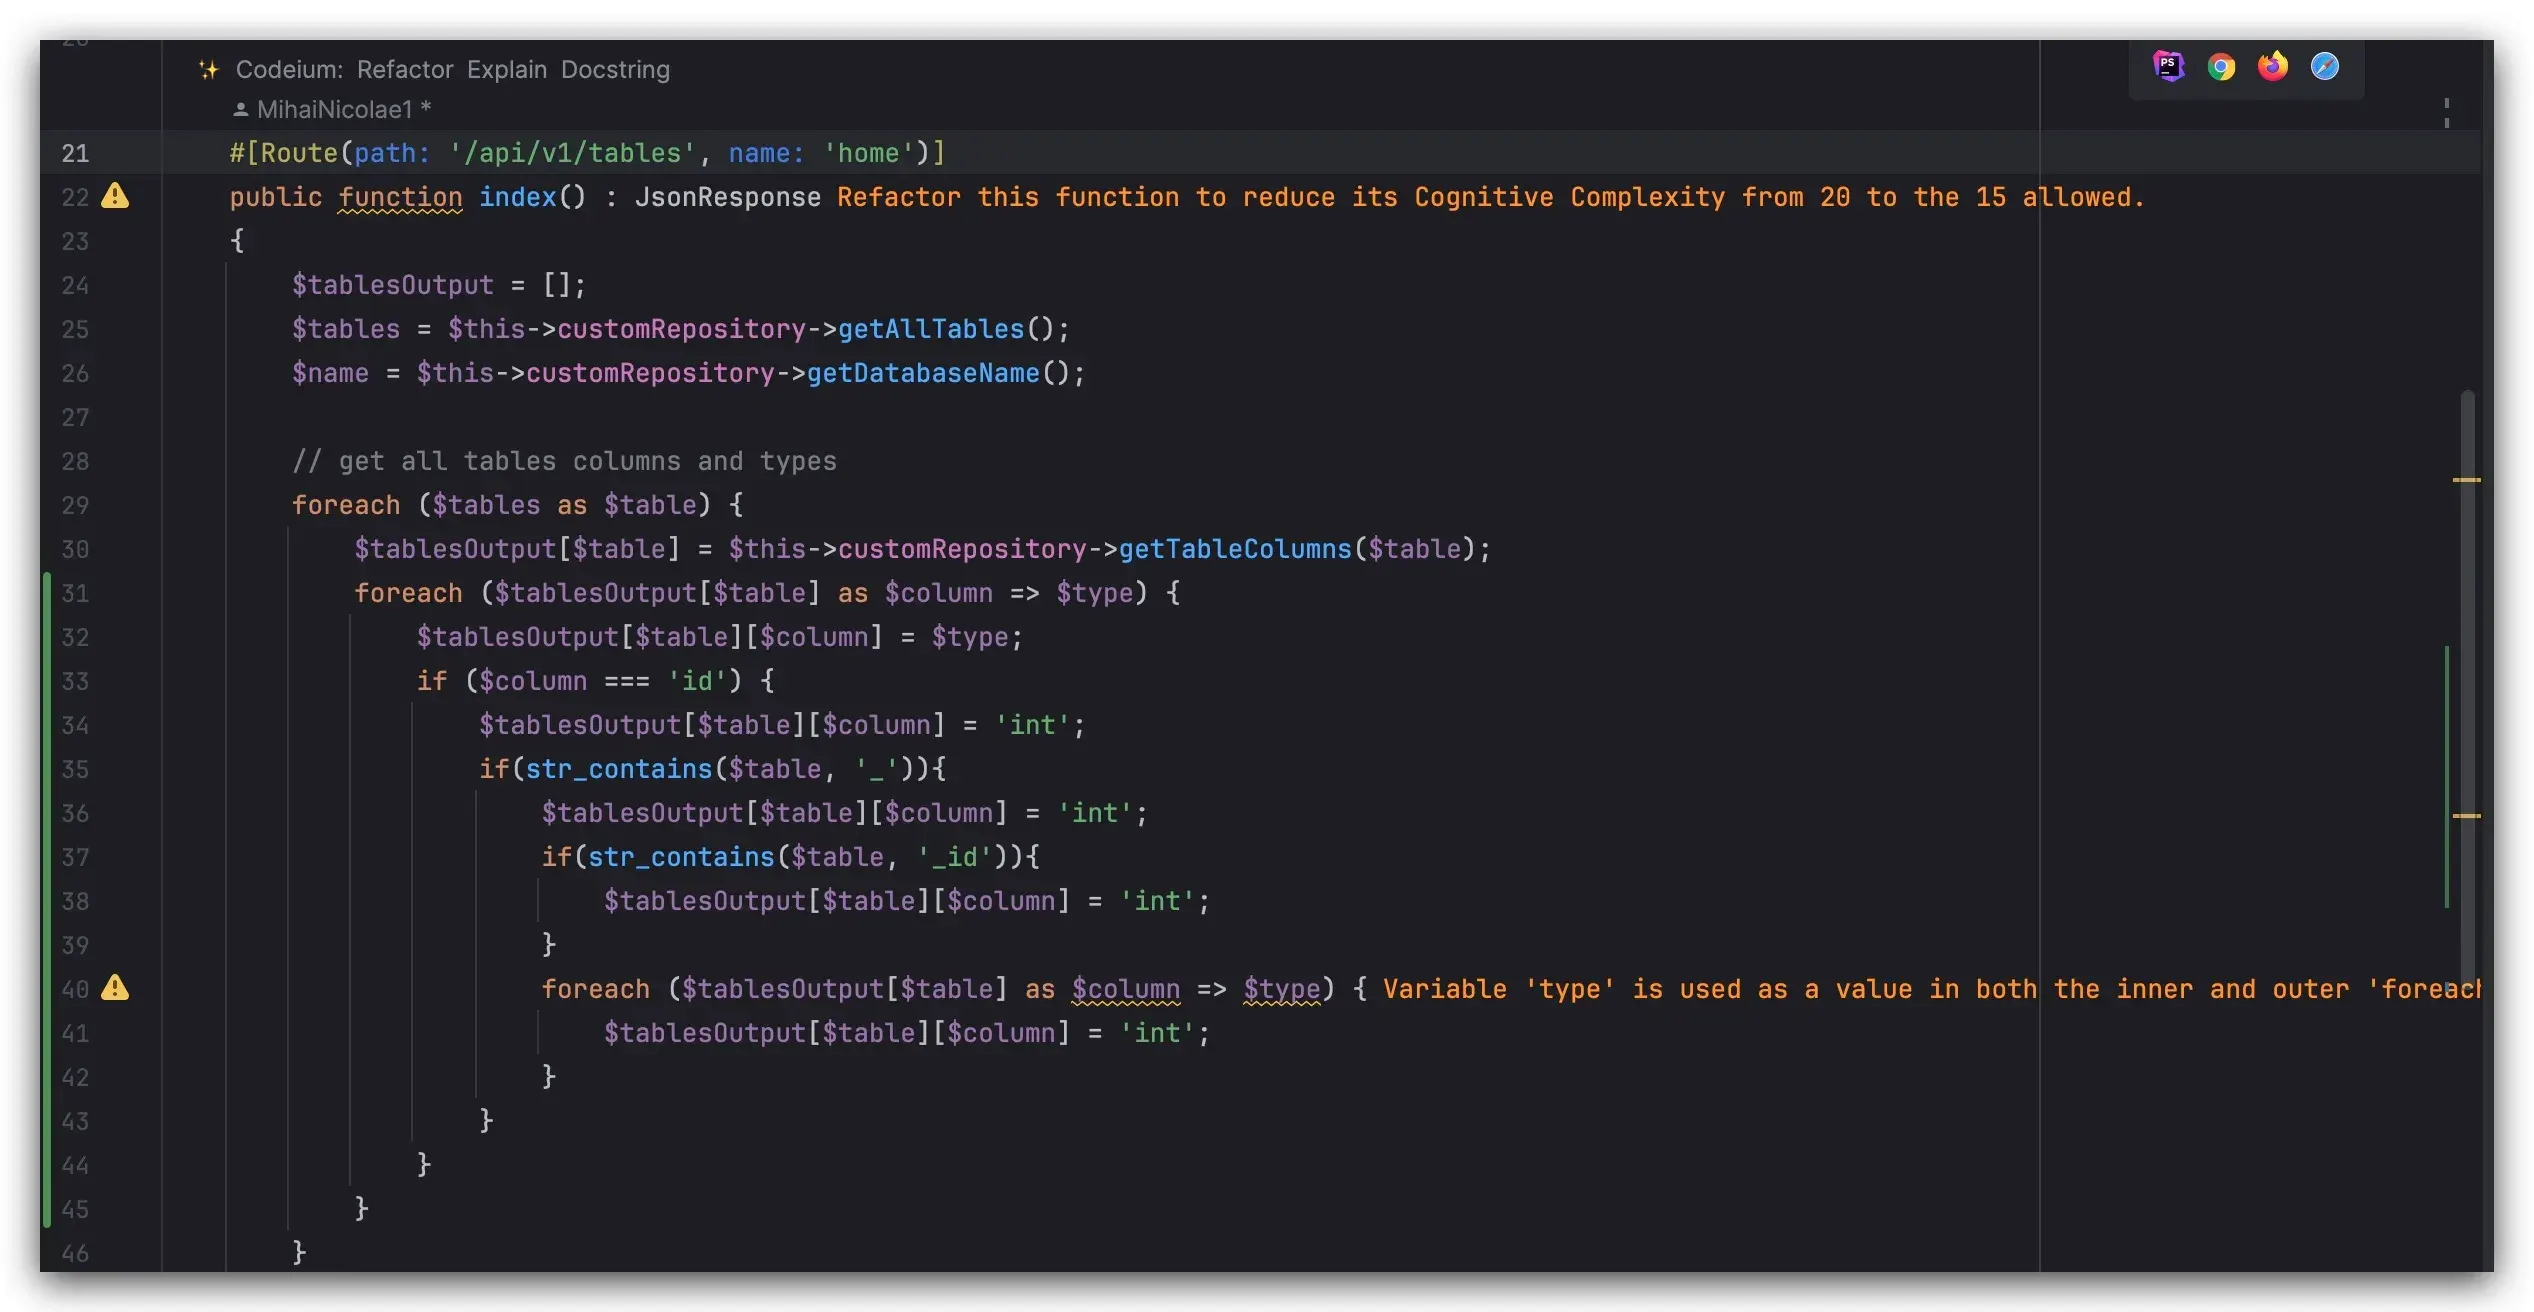
The SonarLint extension identifies unused variables, popular code smells, and also calculates the cognitive complexity of your methods.
4. Team Knowledge
It is important to have a team that is knowledgeable about the codebase. This can be achieved by having a good onboarding process with strong confluence documentations for all the business and technical flows.
One good starting point is also to have a common knowledge sharing session, where each team member presents something notable he/she implemented in the past weeks.
Finding authors that contributed a lot to the codebase but are no longer in the team can also be a good starting point. Those areas are usually the most problematic ones since the current team members are not familiar with the code, and that area of the code may be a ticking time bomb.
5. Refactoring
Refactoring can also be a good example of how you can keep your code clean and avoid disasters.
Note: Large-scale refactorings should always be done only when you have real benefits from them. The costs of refactoring and the potential risks that come with it may outweigh the benefits.